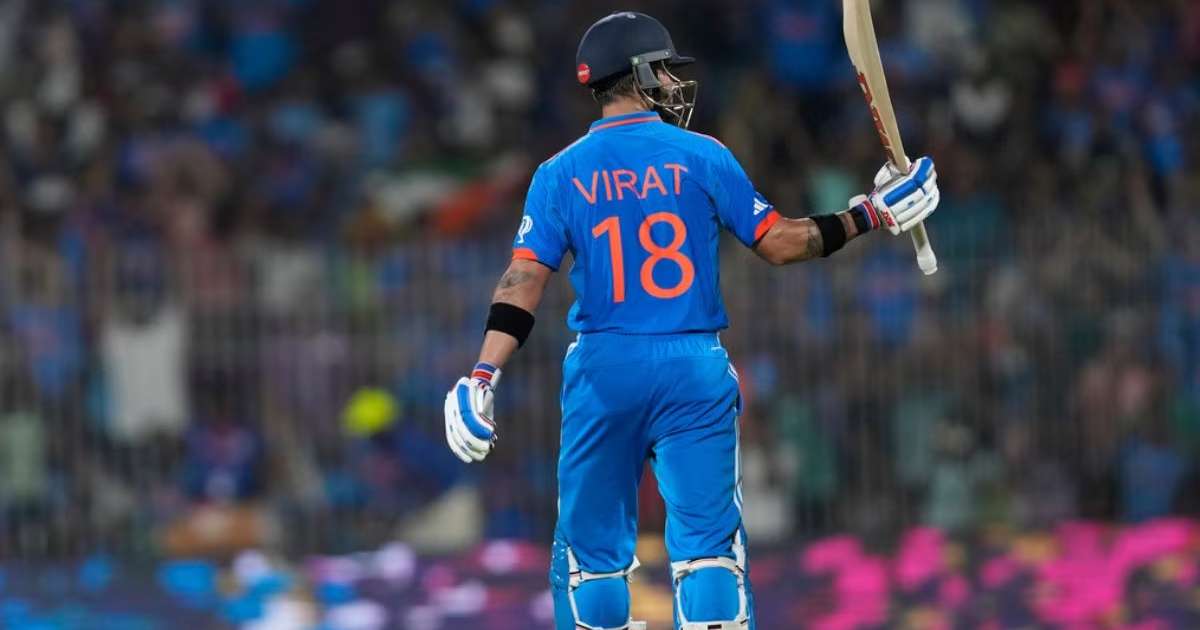
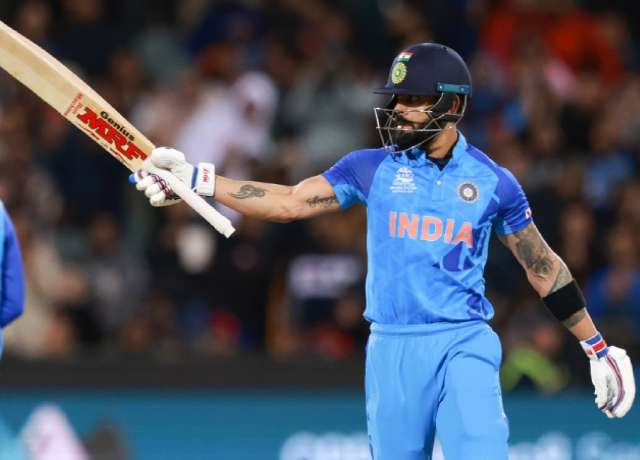
Virat Kohli is a very popular global sportsperson; he is among the top players in modern-day cricket. He made and broken many records in his career so far. Virat Kohli faced a very bad patch in his career after 2019, his performance kept going down but he made a remarkable comeback in 2022. In this article, we will draw a statistical comparison between Virat Kohli’s bad phase record and how he changed those numbers in his comeback.
- Matches – From December 2019 to July 2022 Virat played 68 matches in all formats combined whereas from August 2022 to December 2023 Virat played 55 matches.
- Innings – Virat batted in 79 innings in his so-called bad phase whereas he batted in 57 innings from August 2022 to December 2023.
- Runs – even after playing a smaller number of innings after his comeback Virat made more runs. He made 2806 runs after August 2022 on the other hand he made only 2554 runs before that.
- Average – from 2019 to July 2022 Virat’s average was 35.47 but he made a very strong comeback after that and since then he made runs at an average of 62.35.
- Strike Rate – in terms of Strike Rate Virat played more aggressively after his comeback where his strike rate was 87.35 whereas his strike rate in his bad patch was 71.52.
- Highest score – it counted as a bad phase for Virat because he did not make a single century for 3 years and his highest score in those years was 94* but after August 2022 he broke his record of highest score in ODIs and made 186.
- Centuries – he made zeros centuries for two and a half years but after August 2022 he made 10 so far.
- Half Centuries – it was a redemption from Virat Kohli, he made 24 half-centuries from December 2019 to July 2022 but he made 16 half-centuries from August 2022 to December 2023.
Also Read: All records Virat Kohli broke in 2023 World Cup


