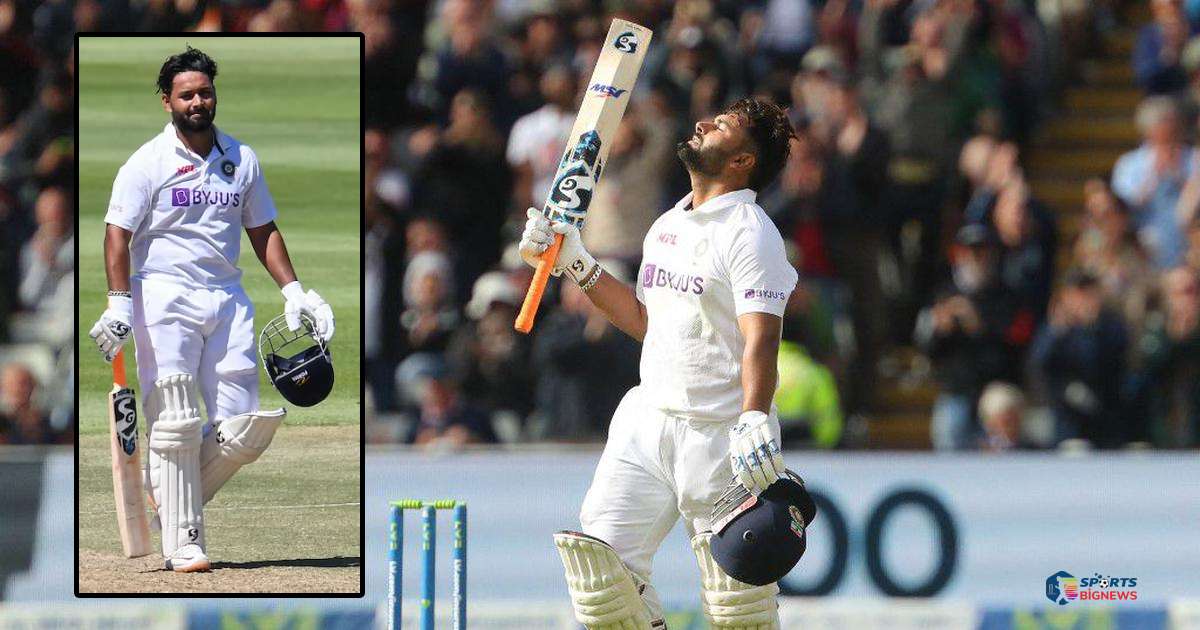
Rishabh Pant suffered an accident in January 2023 and since then India has failed to produce wicketkeeper batsmen like him. Especially in tests, Rishabh Pant was a different breed. He was becoming a very reliable keeper batsman before he met with an accident. In this article, we will give you a stats comparison between Rishabh Pant and other wicketkeepers which includes Wriddhiman Saha and KS Bharat.
Rishabh Pant Test Stats
- Matches – Rishabh Pant alone played in 33 test matches since 2018 whereas other keepers played in 25 test matches since 2018.
- Innings – Rishabh Pant batted in 56 innings out of those 33 tests but other keepers batted in only 39 innings out of 25 test matches.
- Runs – there is a huge difference in runs between other keepers and Rishabh Pant. Rishabh Pant made 2271 runs for India in tests since 2018 whereas other keepers which include Saha and Bharat made only 690 runs.
- Average – a combined average of Saha and Bharat in tests is 20.29 whereas Rishabh Pant who is way ahead of them has an average of 43.67.
- Strike Rate – Strike rate is not a necessary stat in tests but for keepers it becomes necessary. They mostly bat in a situation where he is required to play fast and sensibly. Rishabh Pant’s strike is 73.63 in tests and on the other hand, the combined strike rate of other keepers is 54.48.
- Highest score – Pant’s highest score in tests in these years was 159* whereas other keepers’ highest score was 101.
- Centuries – Rishabh Pant alone made 5 centuries in these years. most of them came outside India in very tense situations. Other keepers made only 1 century in these years.
Half centuries – there are only 2 half-centuries scored by other keeper batsmen since 2018 and on the other hand Rishabh Pant made 11 half-centuries in tests since 2018.


