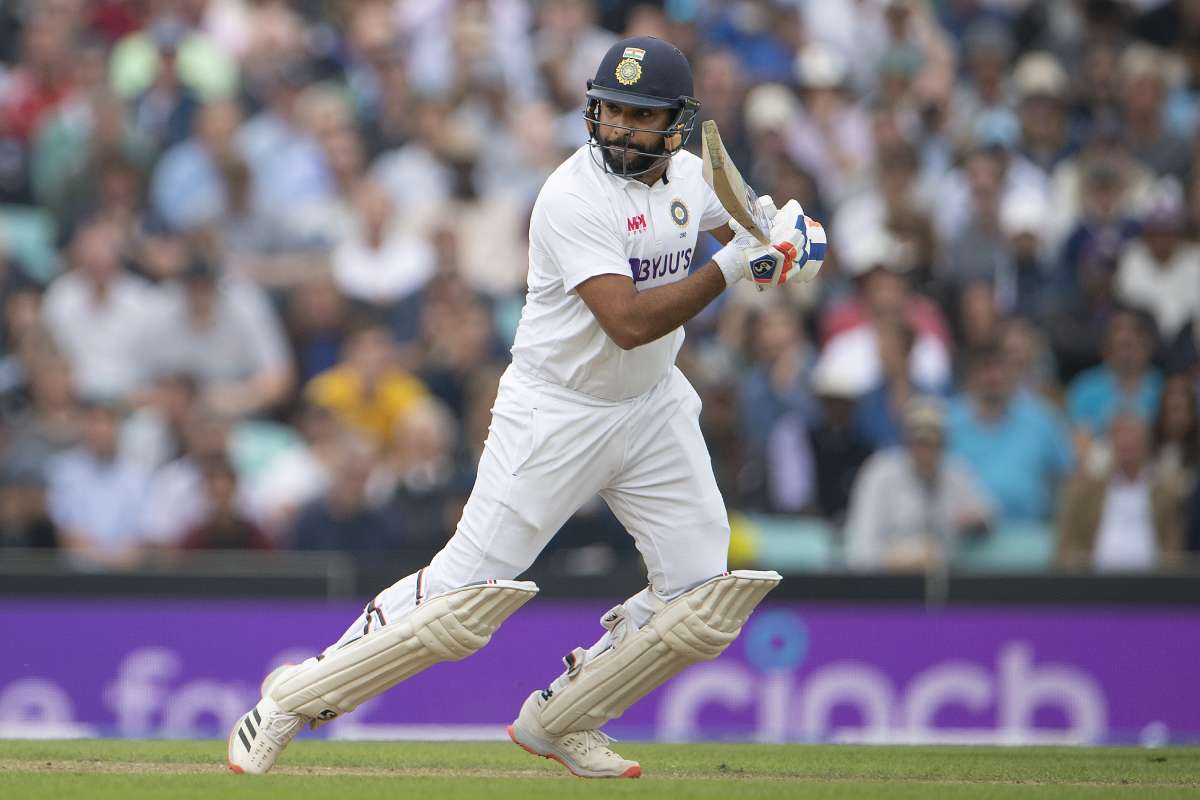
Rohit Sharma’s performance in Test cricket has evolved significantly since his debut in 2013. Below is a detailed year-by-year breakdown of his batting average and key statistics:
Rohit Sharma’s Yearly Batting Average and Performance
| Year | Innings | Runs | Average | 100 | 50 | Highest Sore |
| 2013 | 6 | 333 | 66.60 | 2 | 1 | 177 |
| 2014 | 10 | 237 | 26.33 | 0 | 0 | 72 |
| 2015 | 13 | 326 | 25.07 | 0 | 3 | 79 |
| 2016 | 7 | 288 | 56.60 | 0 | 3 | 82 |
| 2017 | 3 | 217 | 217.00 | 1 | 2 | 102* |
| 2018 | 8 | 184 | 26.28 | 0 | 1 | 63* |
| 2019 | 6 | 556 | 92.66 | 3 | 0 | 212 |
| 2021 | 21 | 906 | 47.68 | 2 | 4 | 61 |
| 2022 | 3 | 90 | 30.00 | 0 | 0 | 146 |
| 2023 | 13 | 545 | 41.92 | 2 | 2 | 120 |
| 2024 | 23 | 597 | 17.13 | 2 | 2 | 131 |
Summary of Career Statistics
. Total Matches: As of December 2024, Rohit has played 66 Tests.
. Total Runs: He has accumulated 4289 runs with an overall batting average of approximately 41.25
. Centuries: Rohit has scored 12 centuries and 18 fifties, with a highest score of 212.
Rohit’s batting average shows a fluctuating trend, particularly in the initial years where he struggled to find consistency, especially in the years following his debut. However, since taking on the role of an opener in Tests around late-2019, his performance has notably improved, culminating in a peak average in the year of his debut as an opener.
His leadership role as captain of the Indian Test team further highlights his importance to Indian cricket, as he continues to build on his legacy within the sport.


